
LUMO SOLAR POWER
LUMO Cloud Monitoring Platform
Product Overview and Interface Guide
Cover image – live device overview with pack voltage, SOC, SOH, cell and temperature summaries.
| LIVE VISIBILITY
Pack, cell and sensor data in one connected view |
EVENT TRACEABILITY
Alarm history, duration and recovery status |
REMOTE SERVICE
Historical analysis before unnecessary site visits |
Interface examples based on LUMO platform data | Demonstration period: May-August 2026
Executive Summary
| CORE POSITIONING The LUMO Cloud Monitoring Platform brings cell-level data, system status, historical trends and alarm records into one remote service interface. Installers and service teams can see the issue, understand the operating sequence and retain evidence before arriving on site. |
- Real-time visibility:View pack voltage, current, SOC, SOH, individual cell voltage, temperature, relay status and communication state.
- Cell-level diagnostics:Quickly identify the highest and lowest cell voltages, voltage spread, temperature extremes and corresponding channels.
- Historical traceability:Replay cell, pack, current and temperature curves by time to establish an operating and fault-evidence trail.
- Closed-loop alarm records:Retain alarm name, level, start time, duration, end time and recovery status.
- Remote service foundation:Platform data supports parameter checks, anomaly localization, Level 4 protection-event analysis and remote balancing decisions.
Platform capabilities at a glance
| Evidence area | Visible example | Operational meaning |
| Live device snapshot | 268.3 V pack; 100% SOC; 96.7% SOH | A compact health and operating-state summary |
| Cell coverage | 80 online cell-voltage channels | Cell-by-cell consistency and outlier visibility |
| Temperature coverage | 20 online thermistors | Thermal distribution and sensor-level diagnosis |
| Snapshot cell spread | 3.409 V max / 3.336 V min (73 mV) | An actionable consistency indicator at that moment |
| Historical diagnostics | Alarm, operating-hours and event-replay views | Evidence for remote service and root-cause review |
Note: The values shown are operating examples from the displayed devices and time windows. Actual readings vary by system configuration and operating conditions.
One connected path from the cells to the service team
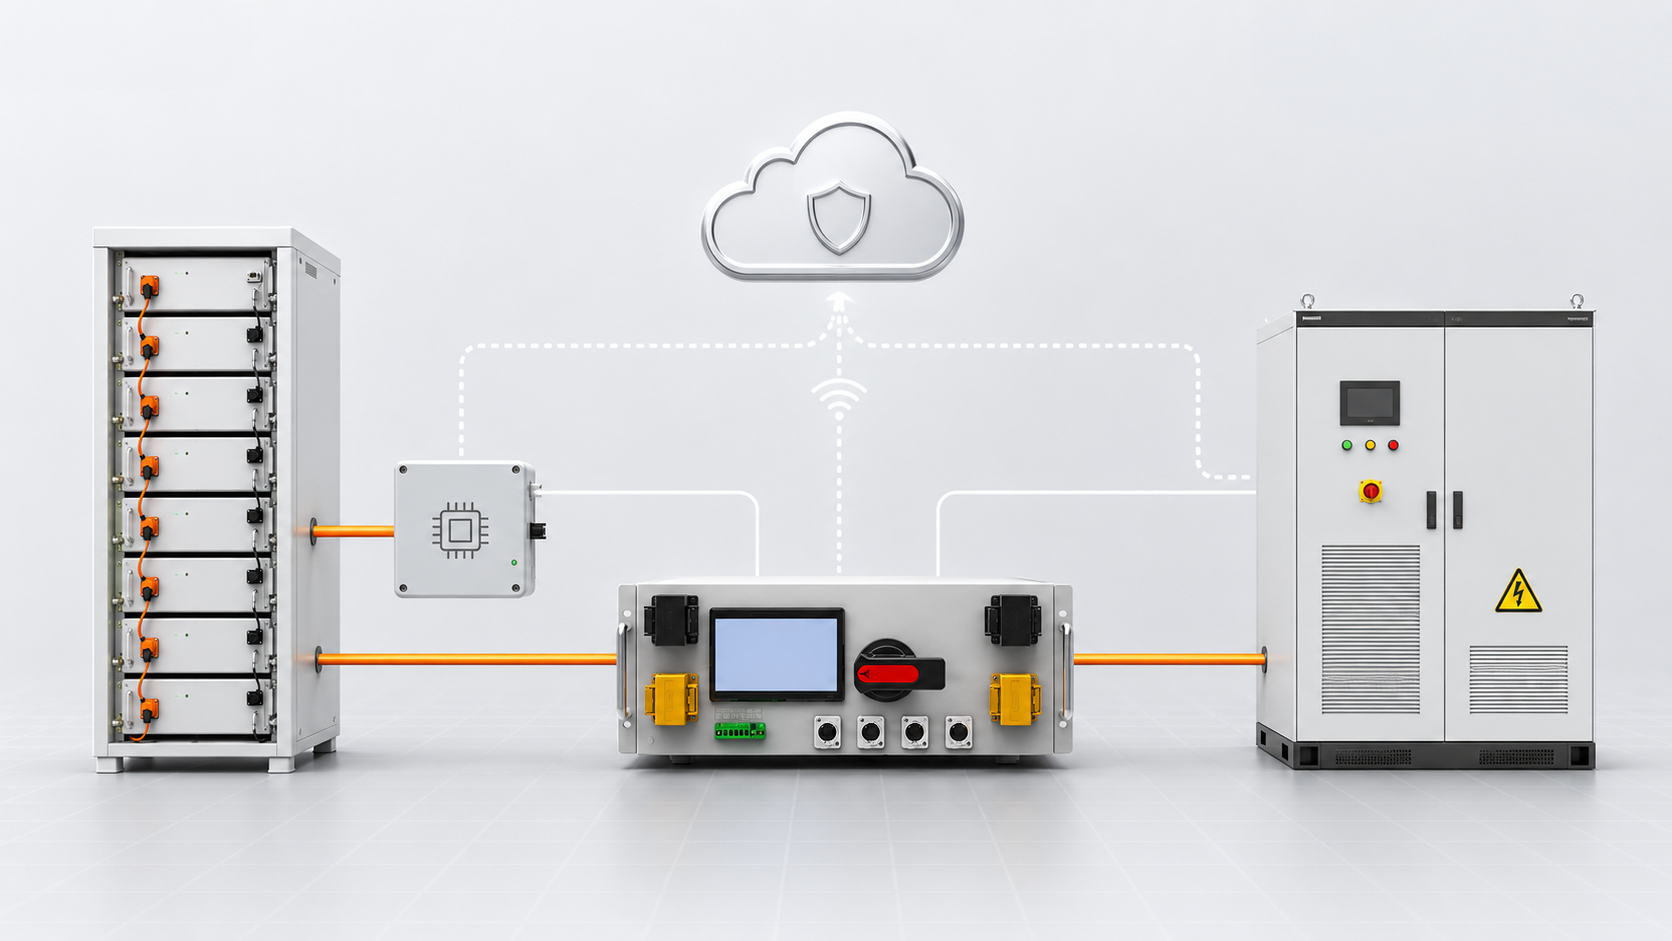
The platform converts raw BMS telemetry into a service workflow. Data moves from cell and temperature sensors through the battery-management and high-voltage control layers, then to the LUMO cloud for live dashboards, alarm records and historical analysis.
| DATA FLOW Cells & sensors → Udan BMS → LMCB300 high-voltage control → network / Wi-Fi → LUMO cloud → installer and service team |
Platform information layers
| Layer | Typical data | Primary use |
| Device identity | HWID, serial number, battery number, model, site/city | Asset identification and fleet organization |
| System state | Wake-up signal, charge/discharge state, relay status, connection state | Confirm whether the system is awake and how it is operating |
| Pack health | Pack voltage, current, SOC, SOH, average voltage and temperature | Fast condition assessment |
| Cell detail | Individual cell voltage, maximum/minimum cell, voltage difference | Detect drift and capacity-limiting outliers |
| Thermal detail | Individual thermistor values, maximum/minimum temperature | Identify hotspots, cold sensors or channel faults |
| Protection evidence | Alarm name, level, duration, end time and repair state | Trace events and support warranty/service diagnosis |
| Historical analytics | Operating hours, voltage, temperature and current trends | Understand actual usage and replay abnormal events |
Customer value
- Commission with clearer evidence: confirm communications, online channels and operating state from one screen.
- Diagnose before travelling: compare live values, event history and historical curves remotely.
- Protect battery health: identify cell-voltage spread, abnormal temperature and repeated protection events earlier.
- Support accountability: retain a time-stamped operating record when settings or usage patterns are questioned.
The live dashboard turns a complex battery into one readable status view
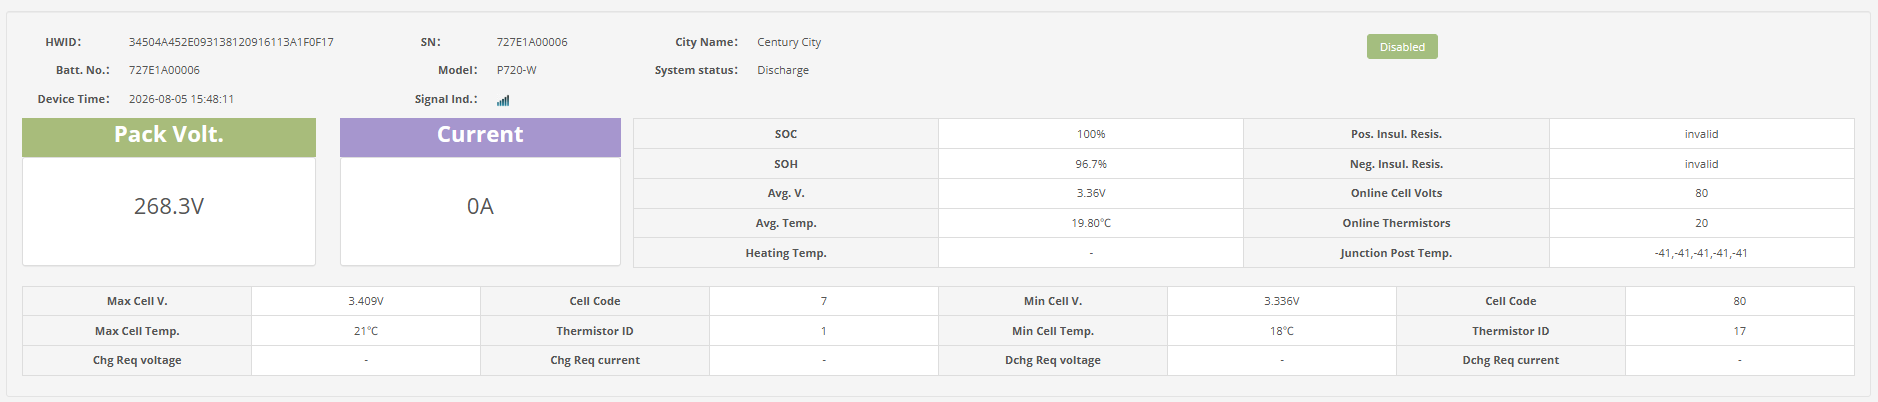
The device overview combines identity, connection status, pack values, cell extremes and temperature extremes. It is the first screen a remote service technician can use to decide whether the issue is electrical, thermal, communications-related or configuration-related.
Figure 1. Live device overview – snapshot at 5 August 2026, 15:48:11.
| Visible metric | Example value | How to read it |
| System status | Discharge | The controller reports the system in discharge state; instantaneous current is 0 A at this exact sample. |
| Pack voltage | 268.3 V | Total battery-string voltage at the snapshot time. |
| SOC / SOH | 100% / 96.7% | Estimated charge level and state of health reported by the BMS. |
| Average cell / temperature | 3.36 V / 19.80°C | Compact indicators of electrical and thermal operating condition. |
| Online channels | 80 cell voltages / 20 thermistors | Only confirmed online channels should be used for diagnostics. |
| Cell extremes | 3.409 V (#7) / 3.336 V (#80) | The 73 mV spread identifies the cells that set the instantaneous range. |
| Temperature extremes | 21°C (#1) / 18°C (#17) | A narrow 3°C active-sensor range in this snapshot. |
High-frequency records preserve the system state, not just the latest number
The telemetry table records sequential device samples with time stamps. In the visible window, samples arrive roughly every 31-33 seconds, allowing service teams to distinguish a transient event from a stable condition.
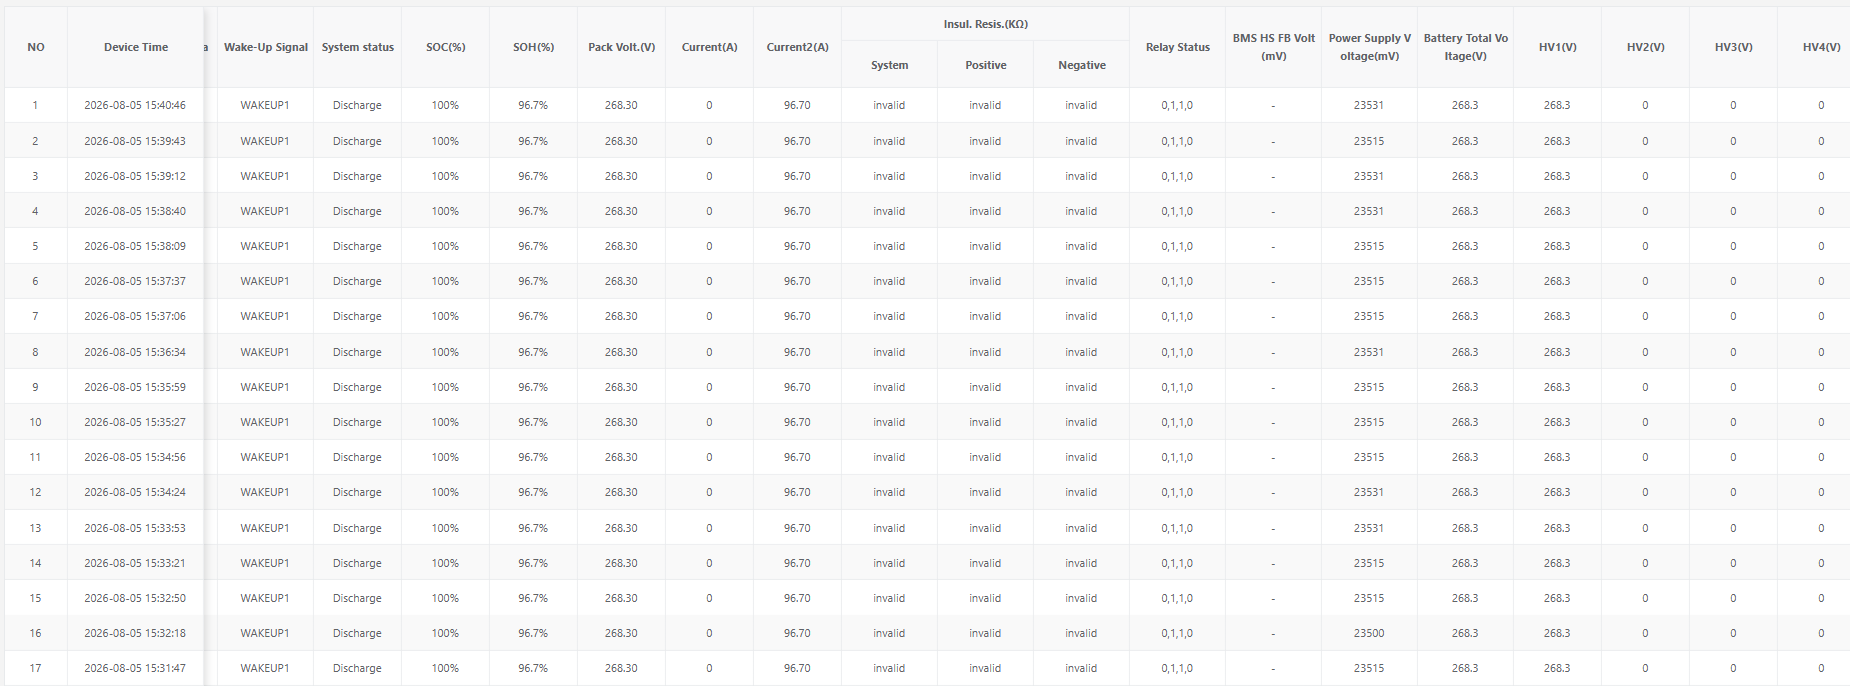
Figure 2. Time-stamped system telemetry – 17 visible records from 15:31:47 to 15:40:46 on 5 August 2026.
Visible pattern
- WAKEUP1 and Discharge remain constant throughout the visible sample window.
- SOC remains 100%, SOH 96.7% and pack voltage 268.30 V across the shown records.
- Control power is approximately 23.500-23.531 V when the millivolt field is converted to volts.
- HV1 follows total battery voltage at 268.3 V, while unused or unavailable HV channels display zero.
| INTERPRETATION RULE Values marked “invalid” are unavailable measurements, not zero insulation resistance. They must be excluded from health calculations and customer-facing claims. |
Maximum and minimum values reveal which cell or sensor is limiting the pack
The max/min telemetry view is designed for fast outlier detection. Instead of scanning every cell manually, the platform identifies the highest and lowest cell, their channel numbers, the voltage difference and the hottest/coldest active sensors.
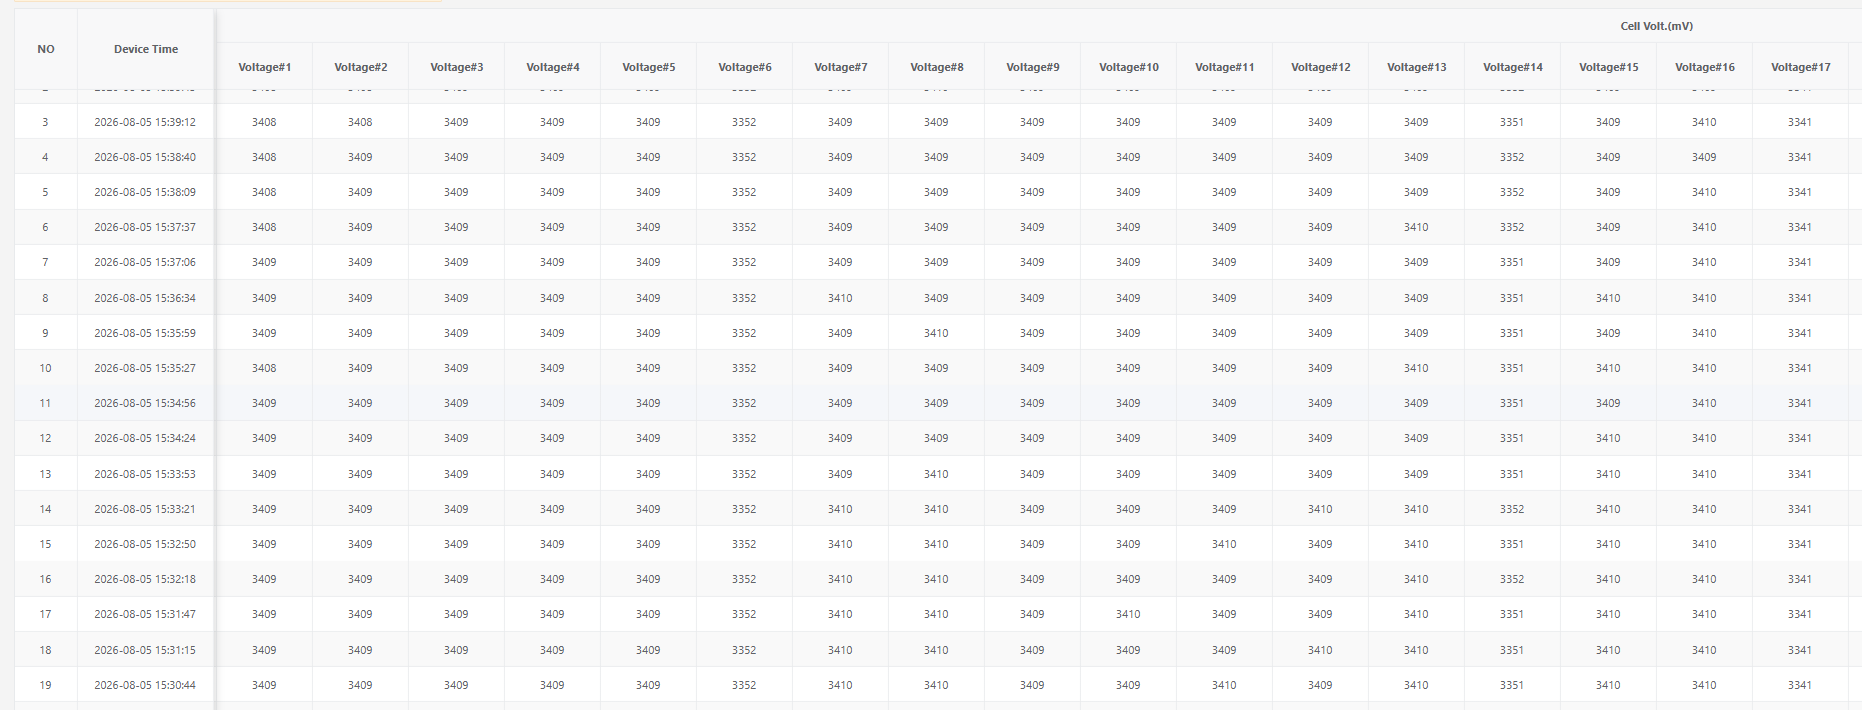
Figure 3. Maximum/minimum cell and temperature telemetry – visible interval around 15:30-15:39 on 5 August 2026.
| Observed field | Visible range | Service implication |
| Maximum cell voltage | 3.410 V | The highest cell is stable, while the channel identity changes among several near-equal cells. |
| Minimum cell voltage | 3.335-3.336 V | Cell #80 is repeatedly identified as the minimum in the shown interval. |
| Cell-voltage difference | 0.074-0.075 V | The instantaneous spread is 74-75 mV and should be interpreted against SOC, current and operating state. |
| Maximum / minimum temperature | 21°C / 18°C | The active sensors show a narrow 3°C range. |
| HV5 value | 6553.5 | Likely an invalid/uninitialized channel value; it is not physically credible as a measured battery voltage. |
Cell-by-cell history makes voltage drift visible over time
The detailed cell table shows each cell voltage at every recorded time. The interface example displays the first 17 cell columns; the device overview confirms that 80 cell-voltage channels are online, so the table continues beyond the visible crop.
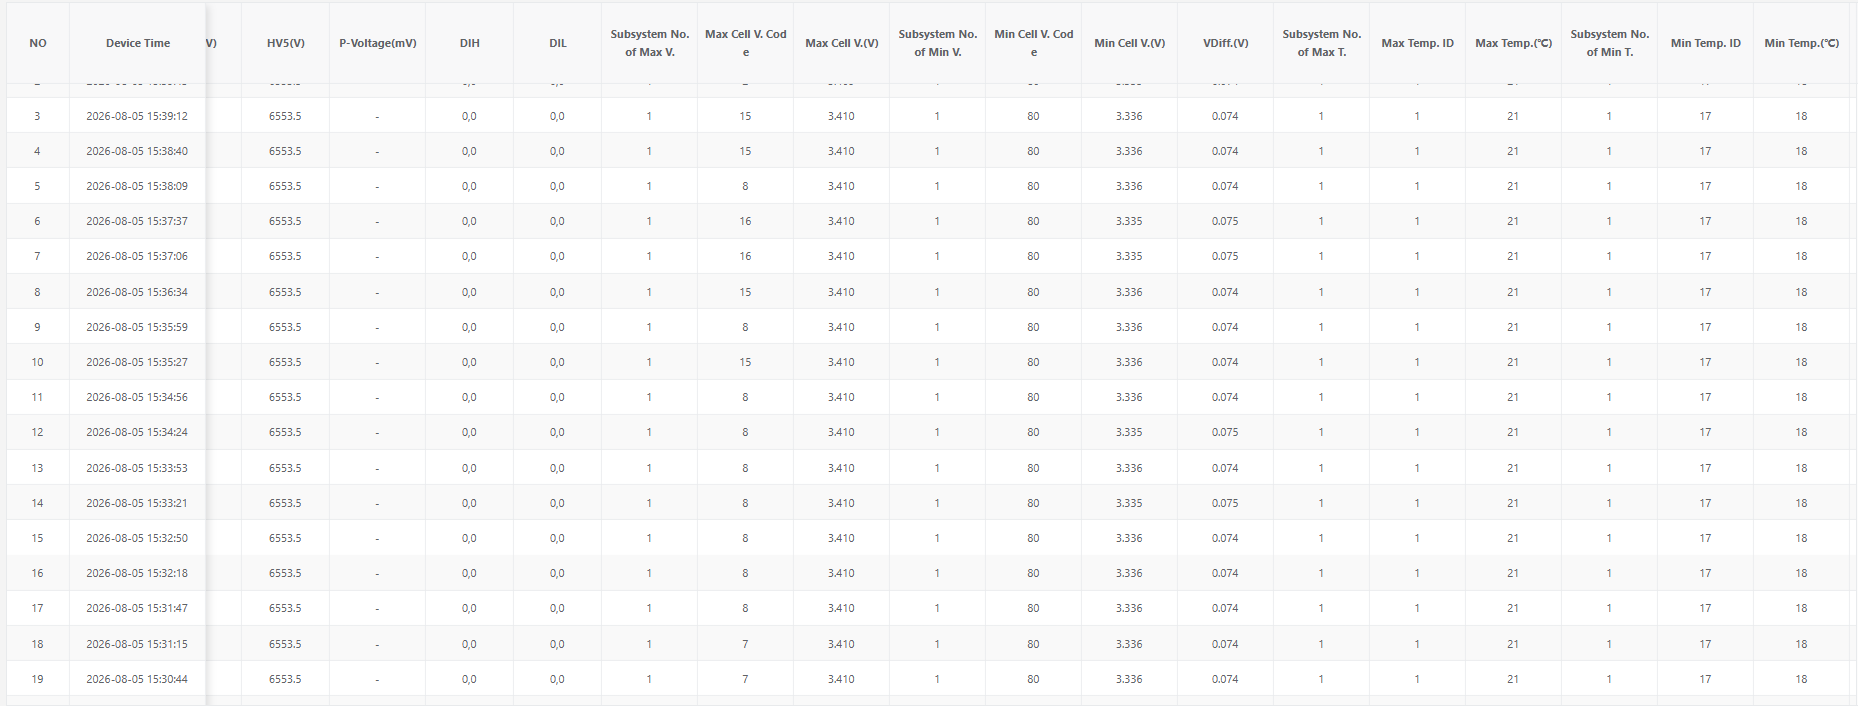
Figure 4. Individual cell-voltage history – visible channels #1 to #17.
What the visible cells show
- Most visible channels remain around 3,408-3,410 mV during the displayed interval.
- Cell #6 remains near 3,352 mV, cell #14 near 3,351-3,352 mV and cell #17 near 3,341 mV.
- The table supports persistence checks: a repeatedly low channel is more diagnostically useful than a single isolated sample.
| IMPORTANT The complete 80-cell dataset is required before ranking the lowest cells. In the live summary, cell #80 is the overall minimum at 3.336 V, even though it is outside this cropped view. |
Distribution charts separate active sensors from unused channels
The cell distribution page gives a quick visual map of all configured measurement channels. Active cell voltages cluster near 3.4 V and active temperatures near 18-21°C. The sharp step to zero voltage after channel #80 and to -41°C after thermistor #20 indicates unused or unavailable channels in this interface configuration.

Figure 5. Cell-voltage and temperature distribution across configured channels.
| DATA HYGIENE Zero-voltage and -41°C placeholder values must be filtered by online-channel status. They should not be included in minimum, average, alarm or fleet-health calculations. |
Why this view matters
- It makes isolated low cells or hot sensors visually obvious.
- It confirms how many channels are actively reporting before deeper analysis begins.
- It helps distinguish a real battery condition from an unconfigured input or sensor-mapping problem.
Alarm history converts protection events into a service record
The alarm table preserves what happened, when it started, how severe it was, how long it lasted and how it ended. This is essential for remote diagnosis, warranty discussions and validation of inverter or charging settings.
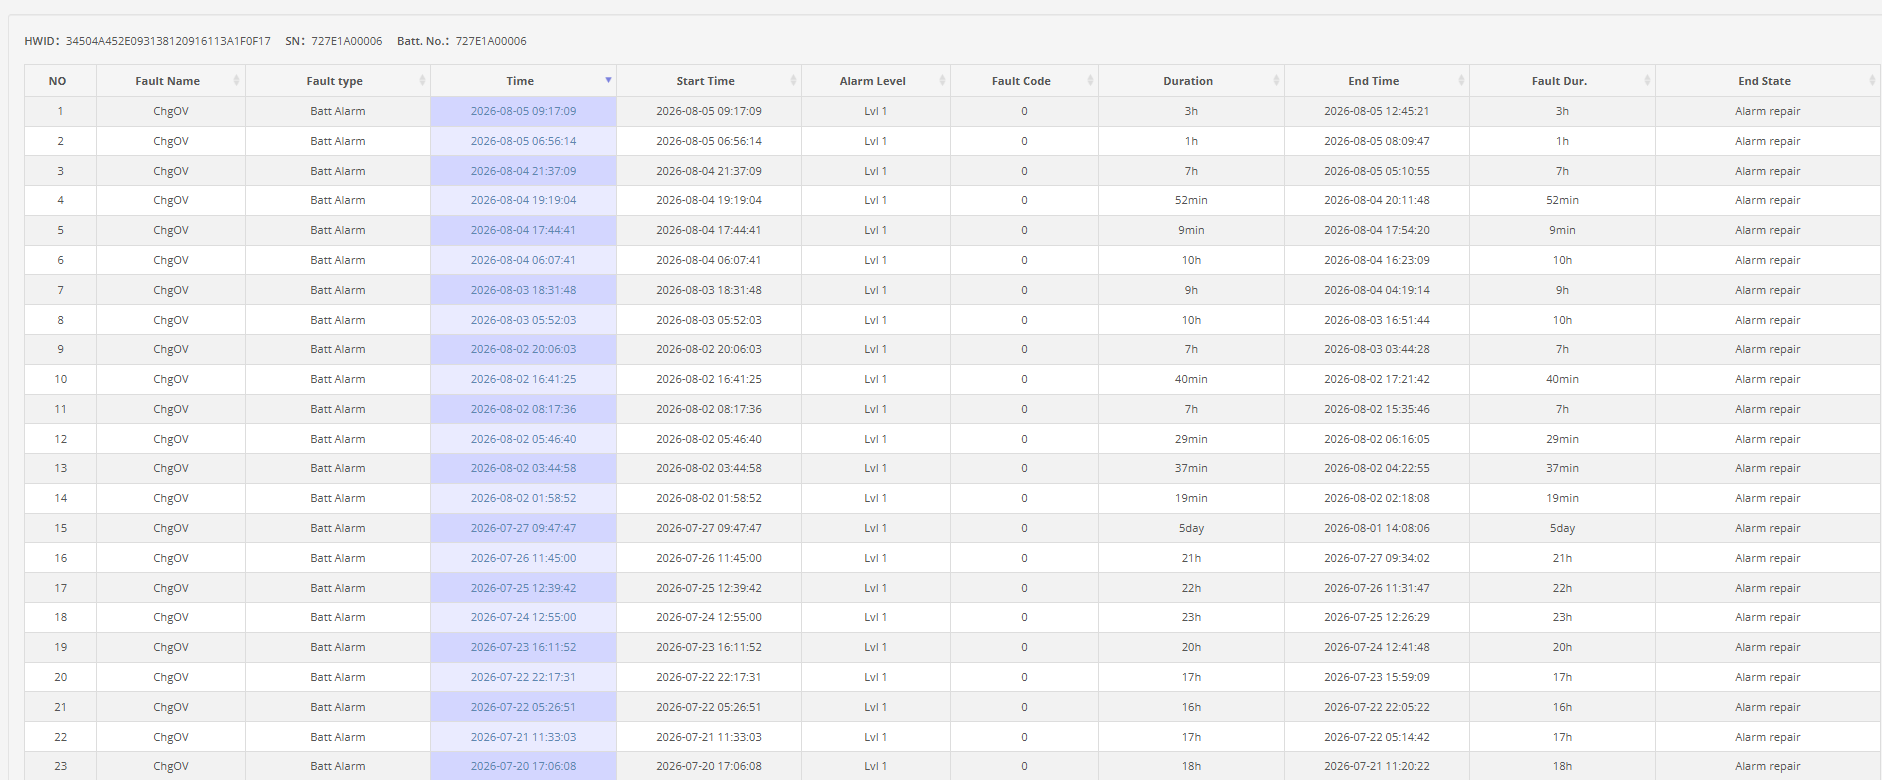
Figure 6. Alarm history – 23 visible ChgOV records from 20 July to 5 August 2026.
Alarm-history capabilities
- All 23 visible records are labelled ChgOV (charging over-voltage), Battery Alarm and Level 1.
- Visible durations range from 9 minutes to 5 days.
- The displayed records end in “Alarm repair”, indicating that the listed events are historical or recovered rather than active alarms at the displayed time.
- Repeated events justify checking charge-voltage limits, inverter settings, cell spread and the alarm threshold configuration.
| SERVICE VALUE A time-stamped event record cannot determine responsibility by itself, but it gives technicians the evidence needed to separate product faults from incorrect settings, abnormal use or communications problems. |
Statistical analysis shows how the battery is actually being used
Operating-hour analysis summarizes daily charge and discharge behaviour across a selected period. The visible chart is filtered from 7 May to 4 August 2026, with the plotted series beginning around 20 May.

Figure 7. Daily operating hours – charge and discharge duration across the selected May-August 2026 period.
How to read the trend
- Discharge duration is generally high, mostly around 20-24 hours per day in the visible period.
- Charge duration is usually shorter, with several visible spikes that warrant correlation with operating schedules and alarm history.
- A pronounced late-July drop in discharge hours and simultaneous rise in charge hours provides a clear investigation point.
Values above are approximate visual readings from the chart. Exported raw data is required for exact totals, averages and performance comparisons.
Historical charting links cell spread, pack voltage, temperature and current
The historical chart aligns four data families on the same time window: maximum/minimum cell voltage, pack voltage, maximum/minimum temperature and current/SOC. This makes it possible to see whether voltage divergence occurs during a current event, whether temperature changes at the same time and whether the pack recovers afterwards.
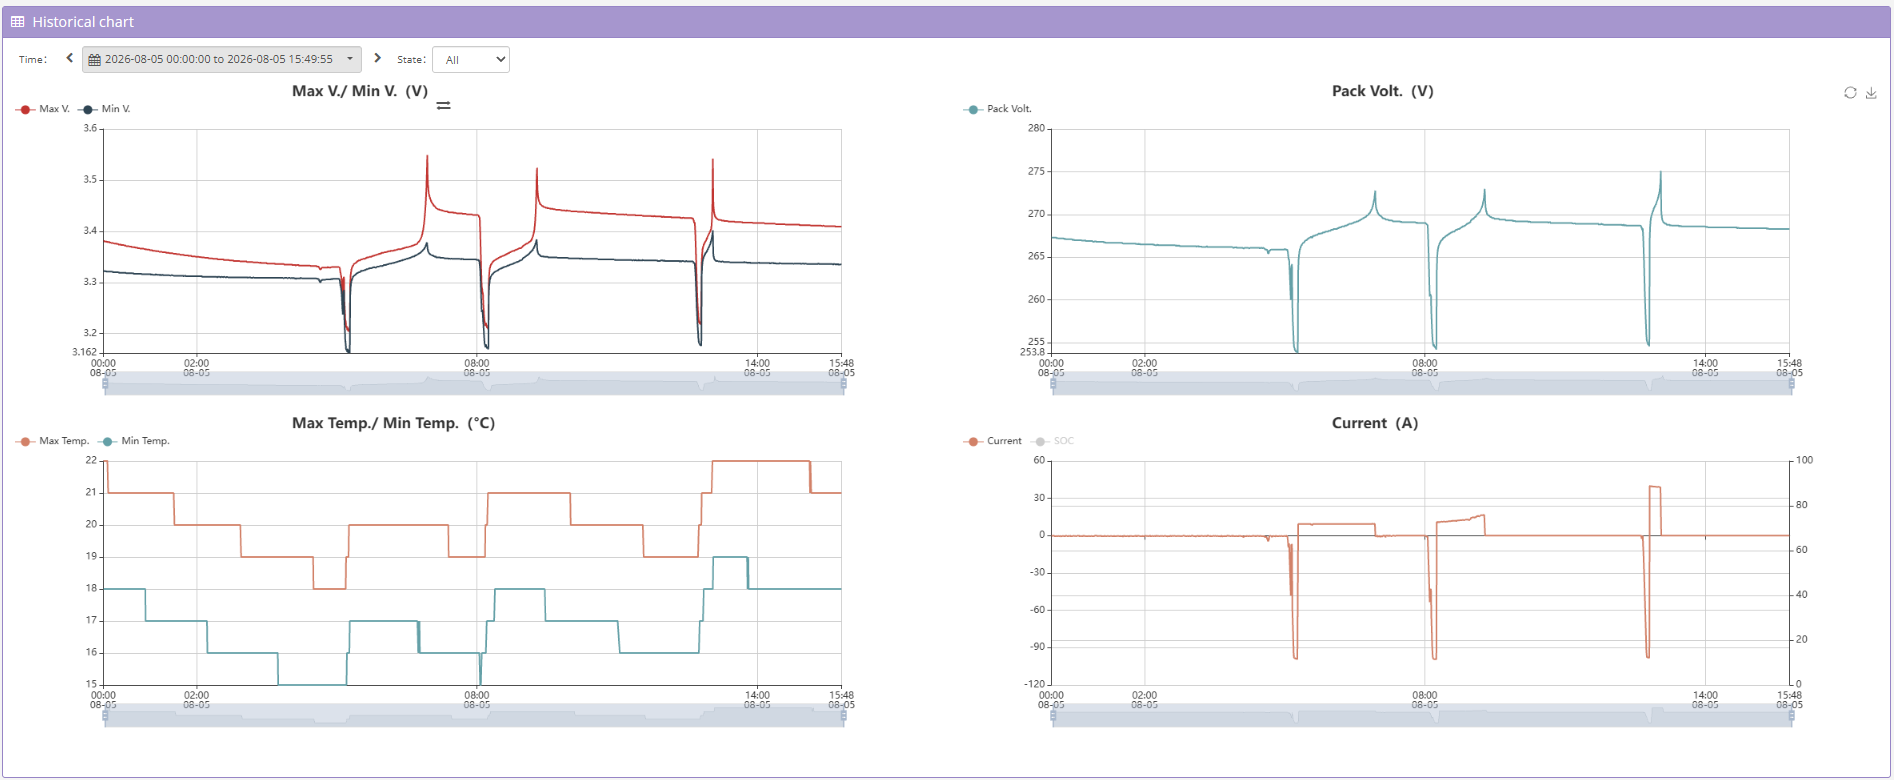
Figure 8. Historical event replay – 5 August 2026, 00:00 to approximately 15:49.
Visible event pattern
- Three pronounced negative-current excursions coincide with sharp pack-voltage dips and temporary changes in maximum/minimum cell voltage.
- A later positive-current peak coincides with a pack-voltage rise; current sign convention should be confirmed before labelling the direction as charge or discharge.
- Active temperature traces remain within an approximate 15-22°C range in the displayed window.
- The chart supports event correlation, but exact current, energy and duration calculations require the downloadable time-series data.
The platform supports a complete remote-service workflow
- Find the device.Confirm HWID, serial number, model, location, connection and latest device time.
- Check live health.Review pack voltage/current, SOC, SOH, average voltage and temperature.
- Check consistency.Identify maximum/minimum cell, voltage difference and temperature extremes.
- Review alarms.Confirm the event name, level, duration, recovery state and recurrence pattern.
- Replay history.Align current events with pack voltage, cell spread, SOC and temperature.
- Take action.Review settings, support remote balancing, monitor recovery or dispatch a technician with a defined task.
Connection to LUMO Level 4 Protection
The cloud platform is the evidence and service layer around LUMO’s protection architecture. When extreme depletion or another critical condition causes the LMCB300 smart breaker to trip, the platform can preserve the preceding SOC, voltage, current, alarm and operating-history context. This helps the service team understand why the physical protection acted and what should be checked before restart.
Connection to adaptive remote balancing
Real-time cell visibility and stored charging curves provide the data foundation for Udan’s remote balancing workflow. After a completed charge lasting more than 15 minutes, the platform can analyse the full charging curve, estimate cell-capacity difference through curve fitting and calculate a personalized balance time. This is data-driven remote balancing, not a claim that balancing is continuously active every second.
Confirmed platform strengths
| Capability | Customer benefit | Interface reference |
| Live cell-to-pack visibility | Faster status checks and earlier drift detection | Figures 1-5 |
| Time-stamped telemetry | Distinguishes persistent conditions from transients | Figures 2-4 |
| Alarm lifecycle records | Improves fault review and service traceability | Figure 6 |
| Usage statistics | Shows how the system operates over weeks and months | Figure 7 |
| Multi-signal event replay | Correlates current, voltage, temperature and cell spread | Figure 8 |
Data dictionary and interpretation rules
| Field | Plain-English meaning | Interpretation note |
| SOC | Estimated state of charge | Use with current and voltage; 100% does not mean every cell is identical. |
| SOH | Estimated state of health | Algorithm-dependent estimate; explain calculation method before making warranty claims. |
| Pack Volt. | Total battery-string voltage | Compare with series configuration and historical operating state. |
| Max / Min Cell V. | Highest and lowest active cell voltage | The difference is an instantaneous consistency indicator, not a standalone diagnosis. |
| VDiff. | Maximum minus minimum cell voltage | Interpret against SOC, current, temperature and duration. |
| Online Cell Volts | Number of reporting cell-voltage channels | Exclude zero/unconfigured channels from analysis. |
| Online Thermistors | Number of reporting temperature sensors | Exclude -41°C placeholder channels from analysis. |
| ChgOV | Charging over-voltage alarm | Review cell voltage, charge limits, inverter settings and alarm thresholds. |
| Relay Status | Reported contactor/relay states | Decode each bit against the product protocol before external publication. |
| Insul. Resis. | Insulation-resistance measurement | “invalid” means unavailable/not valid, not zero resistance. |
Reliable data interpretation
- Analysis uses configured channels that are actively reporting to the platform.
- Zero-voltage and -41°C placeholder channels are recognized as unavailable inputs and excluded from valid-channel statistics.
- Unavailable insulation-resistance readings are displayed as “invalid” and are not interpreted as zero.
- Raw millivolt fields are converted to customer-friendly volts while retaining units and precision.
- Commissioning confirms field mapping, connected sensor counts and current sign convention.
- Historical records provide the operating evidence technicians need to evaluate conditions in context.
| OPERATIONAL CONTEXT Displayed values should be interpreted with SOC, current, temperature, duration and system state. Platform analytics support diagnosis and service decisions; final actions remain subject to the configured battery, inverter and site operating limits. |
Connected intelligence for energy storage
SEE EVERY CELL. UNDERSTAND EVERY EVENT.
Cloud intelligence for safer, more serviceable energy storage.
The LUMO Cloud Monitoring Platform gives installers, system owners and service teams a live view of battery performance from pack level down to individual cells. Connected operating data brings pack voltage, current, SOC, SOH, cell-voltage spread, temperature, relay state and alarm history into one remote service environment.
Instead of relying on a single site visit or the latest alarm code, LUMO preserves the operating story behind every event. Time-stamped telemetry, alarm duration and recovery records, daily operating statistics and synchronized historical charts help technicians understand what changed, when it changed and how the battery responded.
Key platform advantages
- Cell-level real-time visibility – monitor individual cell voltage and active temperature sensors, not only pack totals.
- Faster remote diagnosis – compare live status, alarms and historical trends before sending a technician to site.
- Traceable protection events – preserve alarm level, start time, duration, end time and recovery status.
- Historical event replay – align current, pack voltage, cell spread, SOC and temperature on the same time window.
- Data foundation for remote balancing – use complete charging-process data to support personalized balancing decisions.
- Support for Level 4 service analysis – retain the context around smart-breaker protection events and abnormal depletion.
Short website summary
| LUMO CLOUD A connected monitoring and service platform for commercial and industrial energy storage. See pack and cell data in real time, trace every alarm, replay historical events and give service teams the evidence they need to protect battery health and resolve issues faster. |
Built for customer confidence
- Monitor pack, cell and thermal performance from one unified remote interface.
- Review alarm timing, duration and recovery status before dispatching service resources.
- Use synchronized historical trends to distinguish isolated events from persistent conditions.
- Support proactive battery-health management with evidence-based balancing and service decisions.
Reviews
There are no reviews yet.